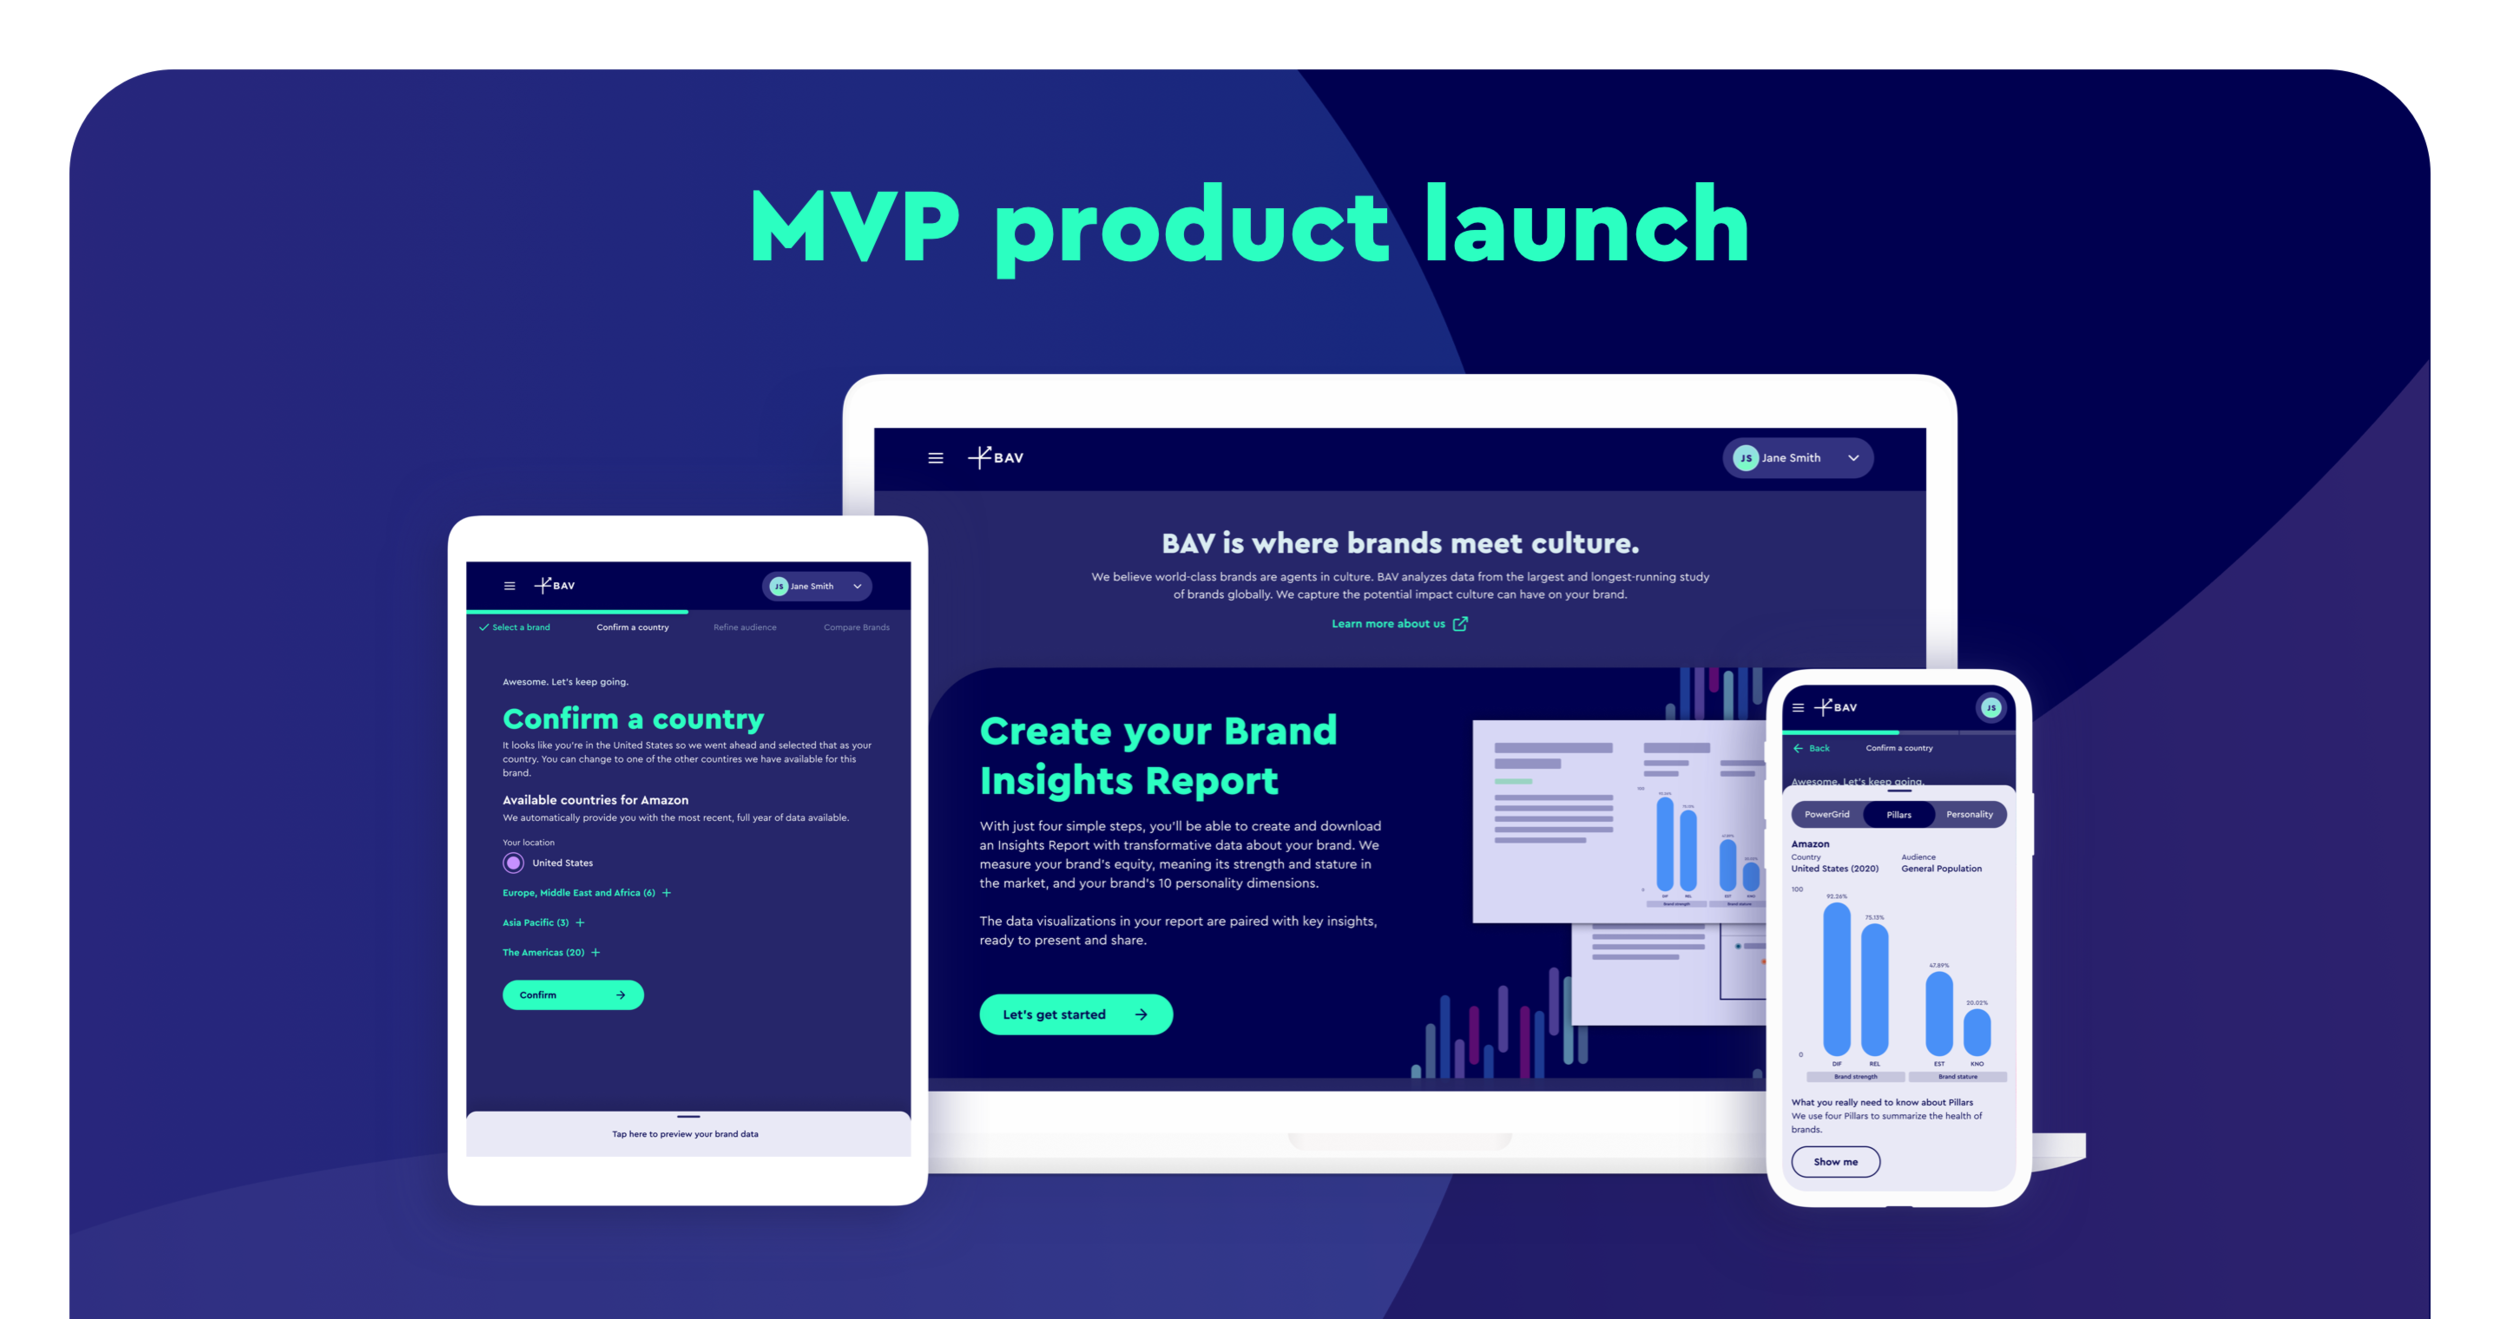

BAV, a research and analytics group within WPP, is the largest, most comprehensive brand analytics platform in the world. Since 1993, BAV has surveyed and collected data for over 52,000 brands globally to help brands understand where they sit within their category and the larger cultural landscape. While data is their product, they’ve always operated as a consultancy group within WPP. In 2021, their new CSO, recognized an opportunity to productize their data in order to take tedious manual tasks off the plates of their consultants. VMLY&R was challenged to design and build a web app experience so that gives all WPP employees access and the ability to create brand insights reports with BAV’s data…all within eight weeks.
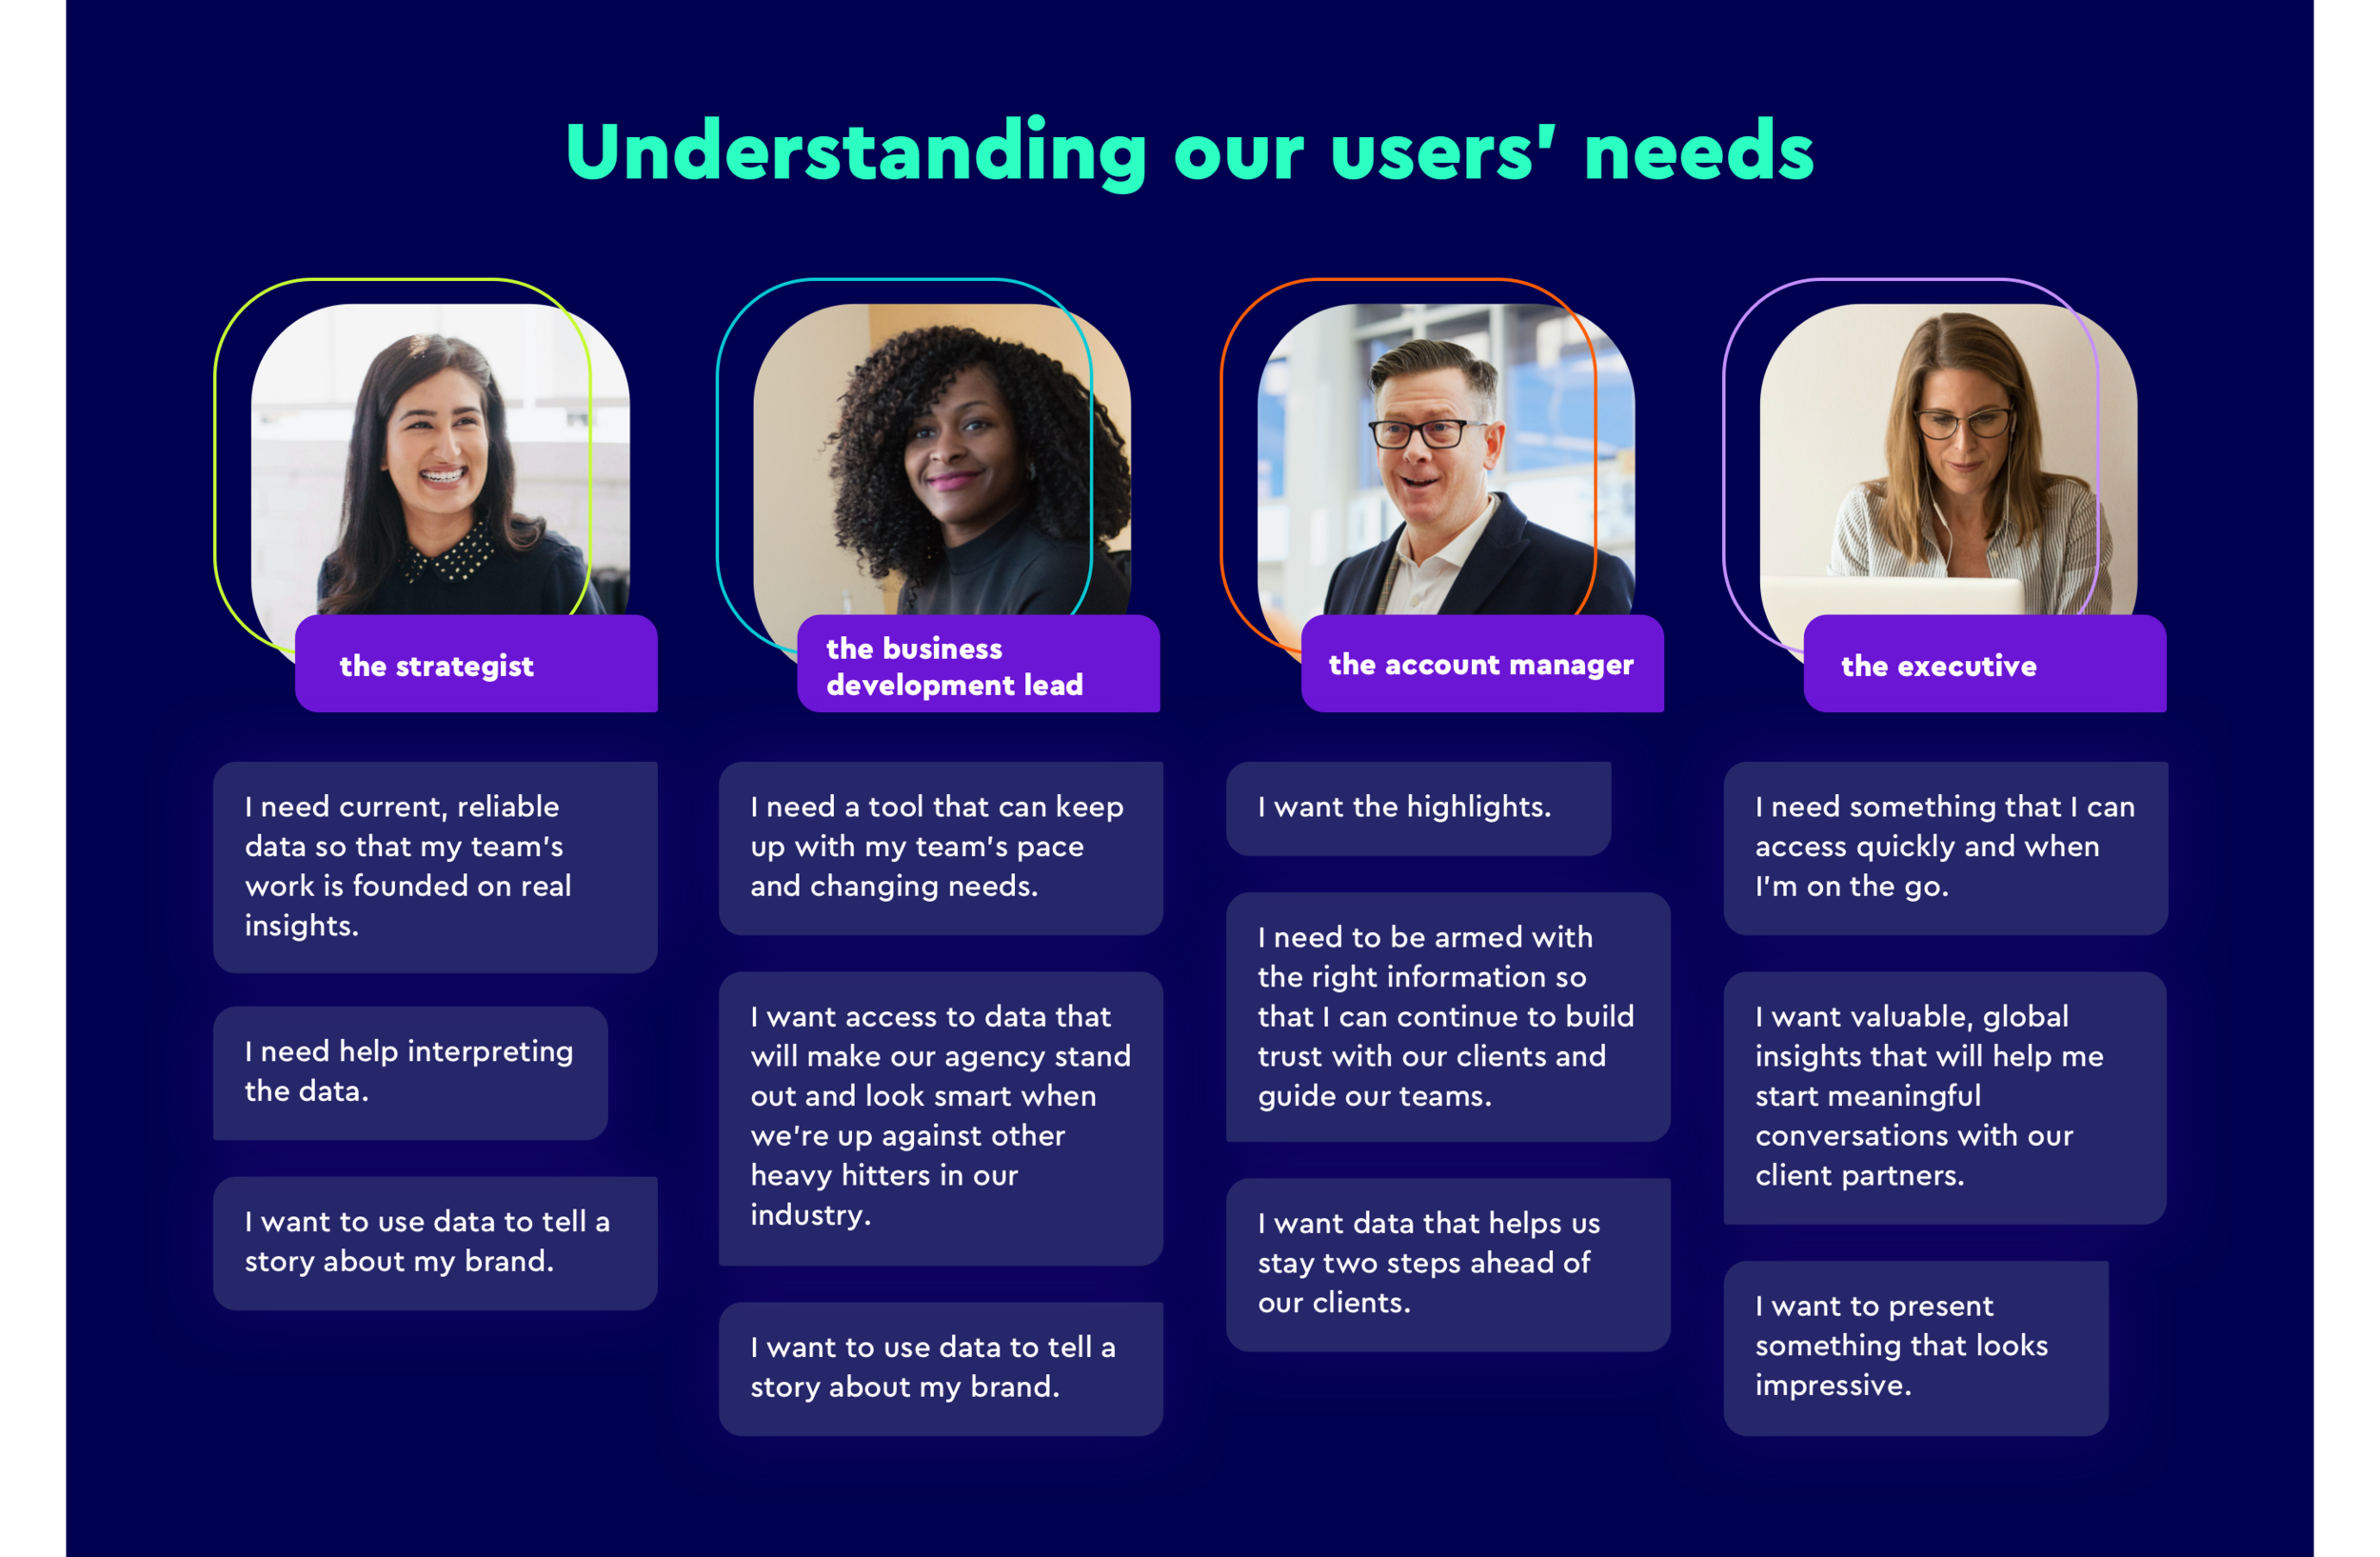
Since we were making the new BAV tool accessible to all employees within the WPP network, we knew we had to really understand the primary users who would be interacting with the tool. They all had different needs and goals, but one thing they all had in common was quick access to brand data that could help inform their teams to create meaningful work and get client partners aligned with strategic decisions.
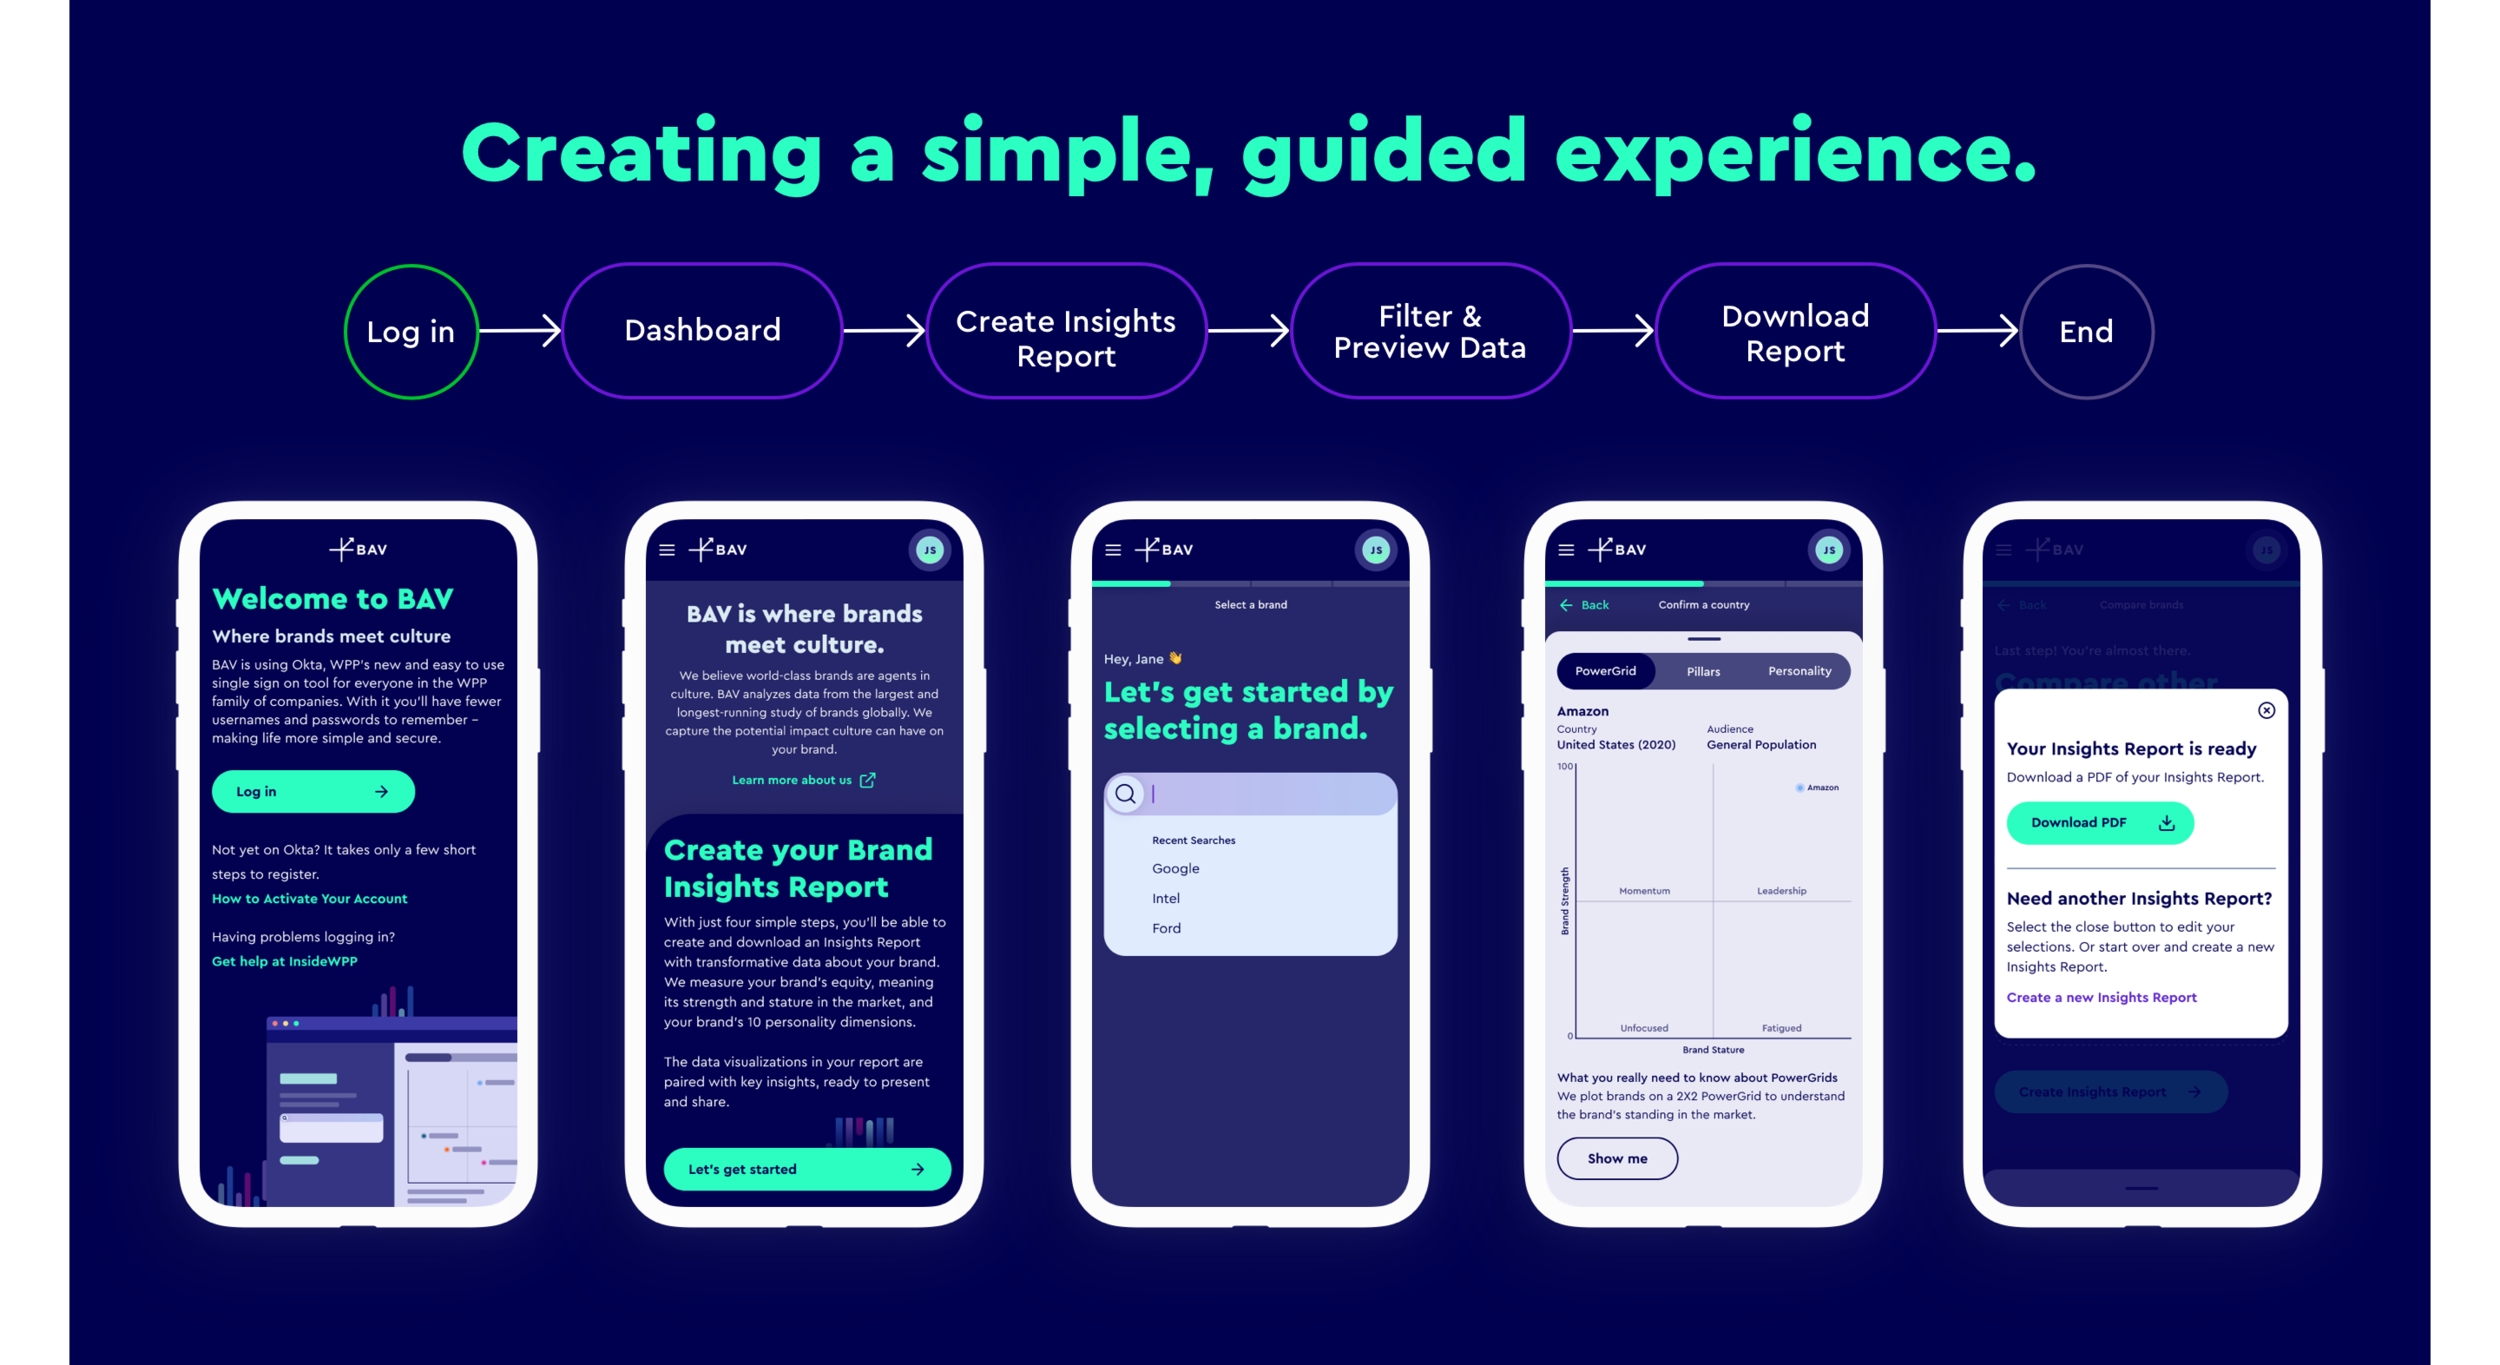
Knowing that our users’ data proficiency would vary, we wanted to create a guided experience that could be easily used by anyone across the network. We accomplished this by managing the complexity of information and the number of decisions that users would need to make at each step.
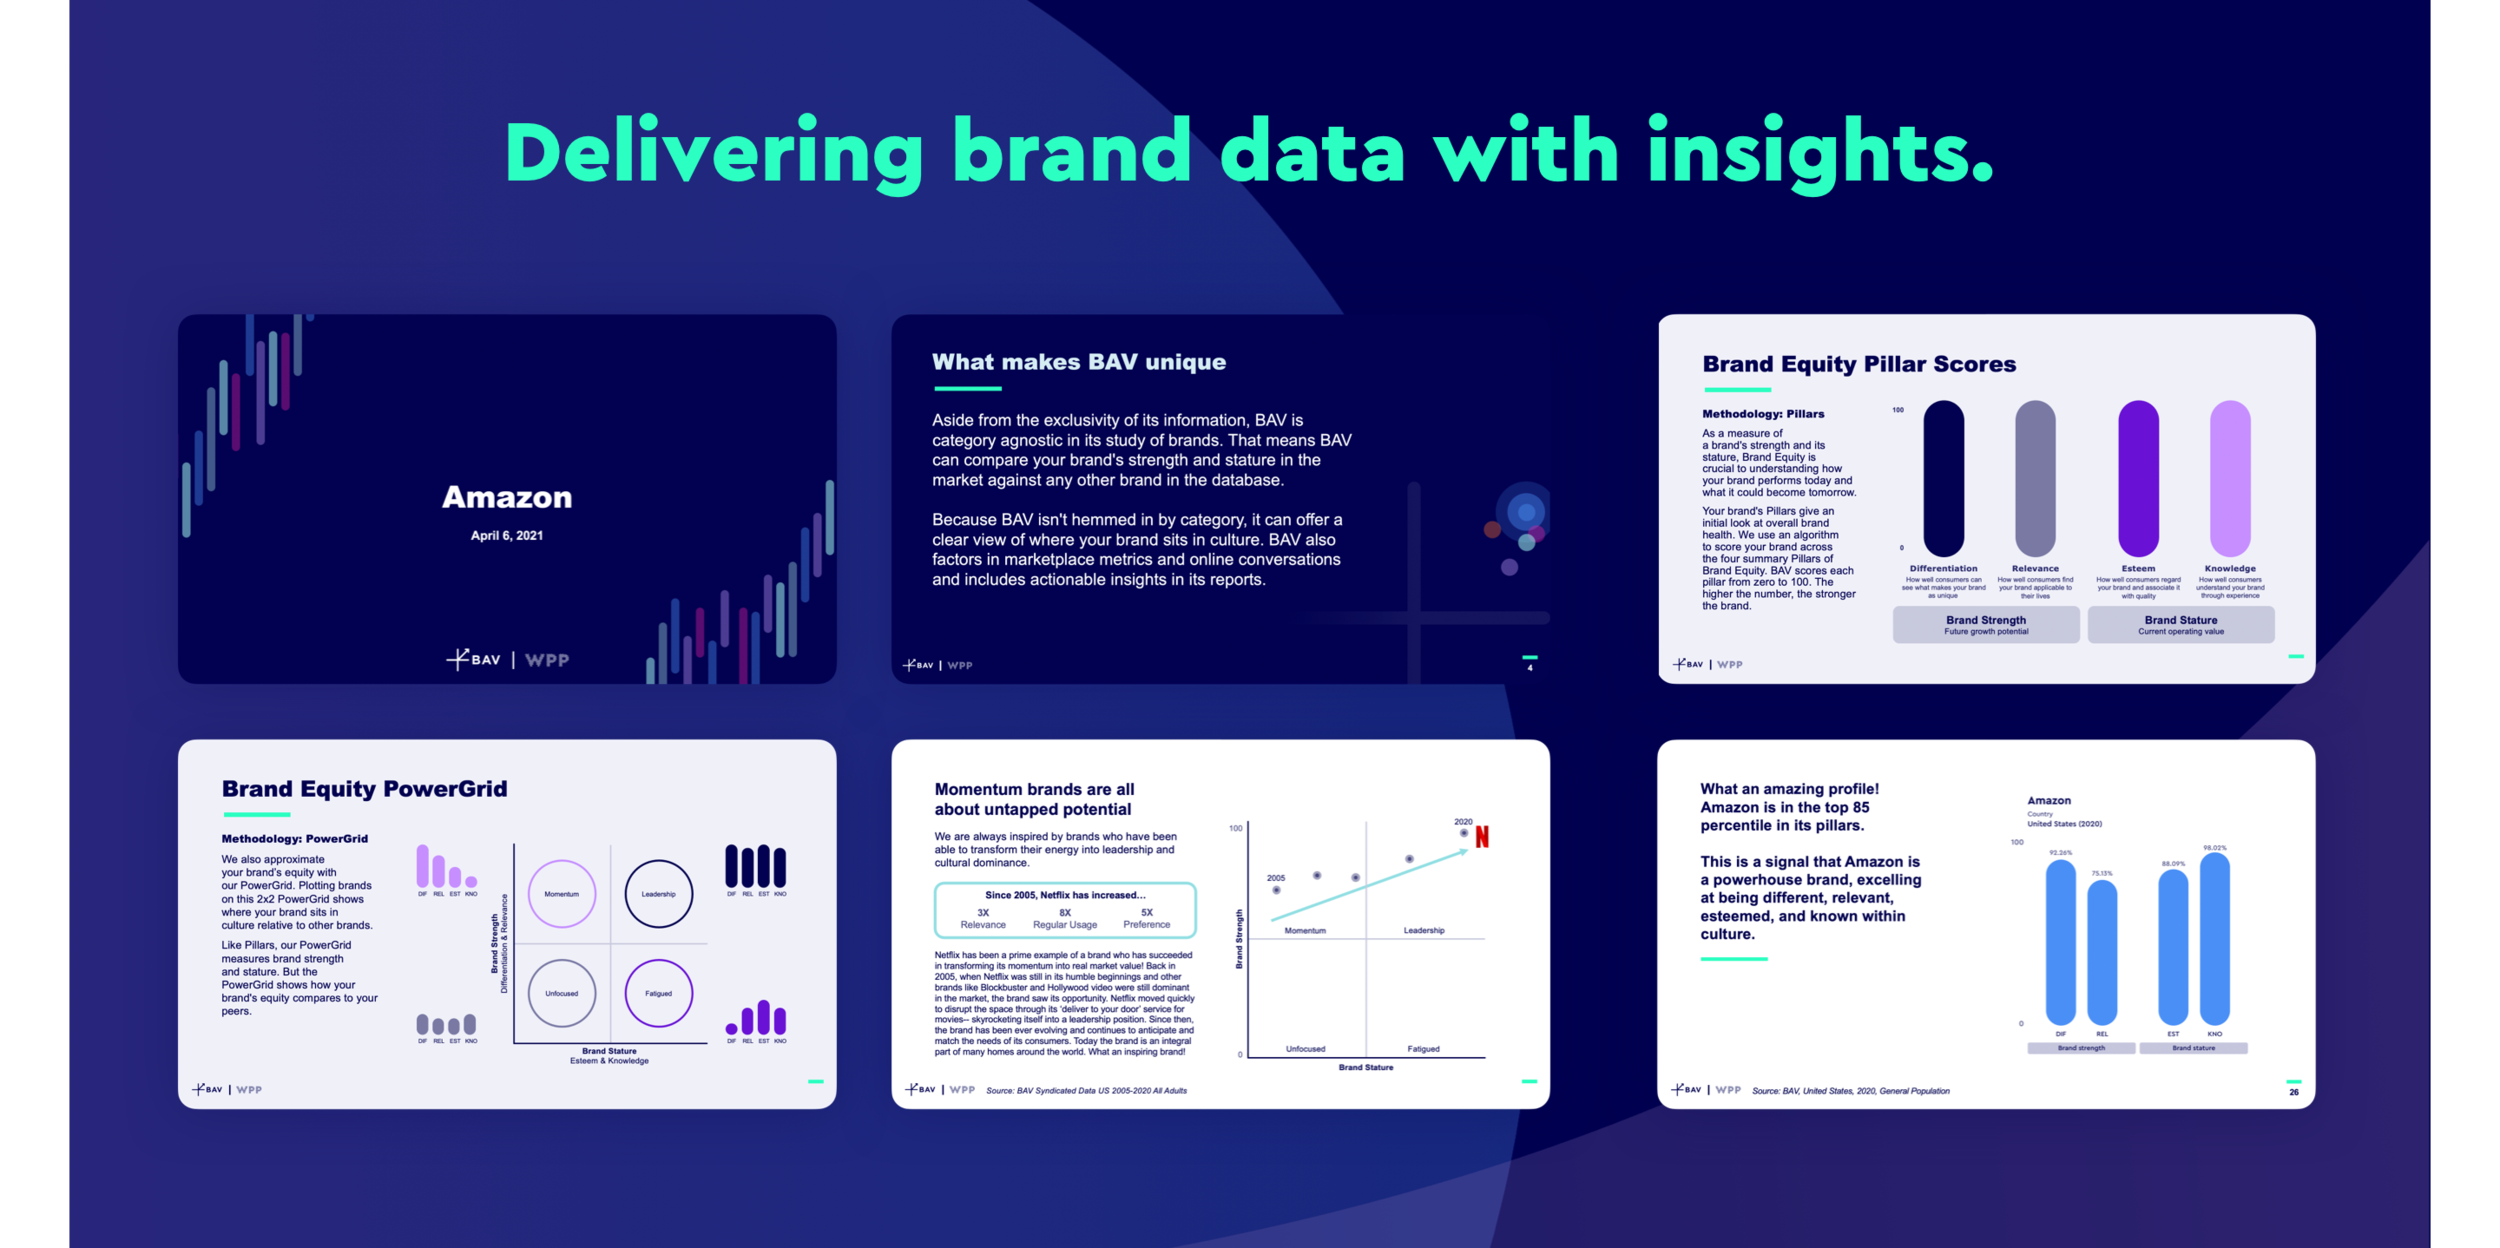
At the end of the experience, users are able to download their insights report as a PDF. The report is presentation-ready and packed with insights to help them understand the data and how to use it.